
In this post, we’ll explore what dimension tables are, why they’re essential in a data warehouse, and how they enhance data analysis by adding layers of context to your data.
What Are Dimension Tables?
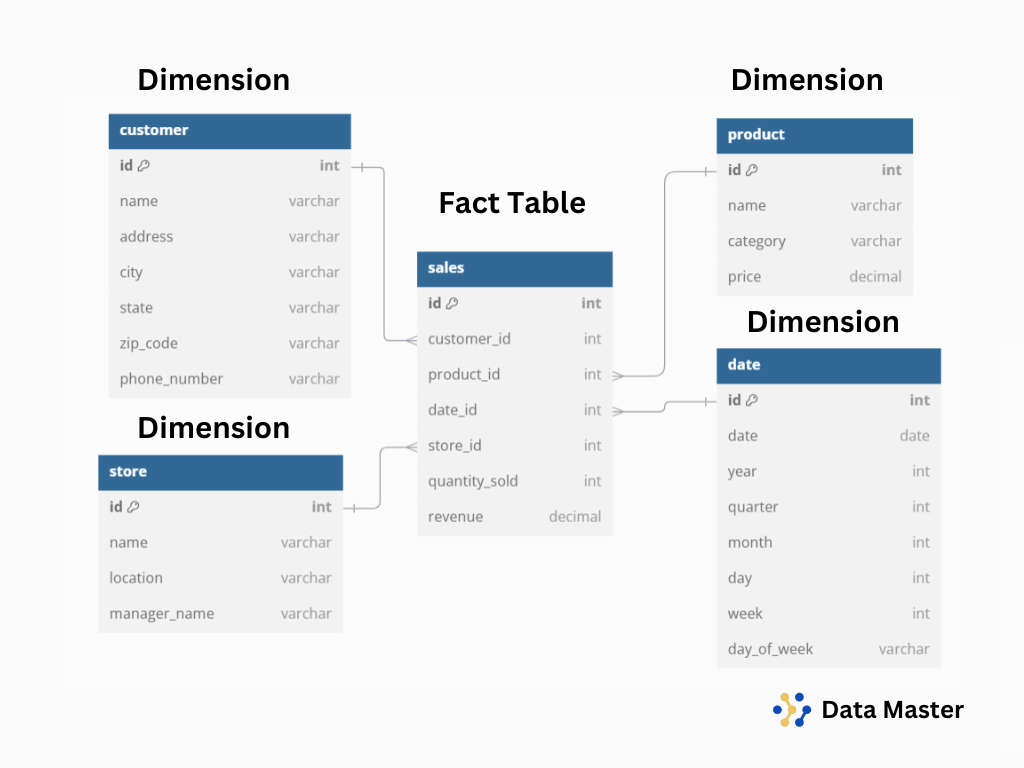
Dimension tables are descriptive tables in a data warehouse that help define “who,” “what,” “where,” and “when” in relation to the data. They contain categorical data, such as dates, product details, geographic locations, and customer attributes, and they work alongside fact tables to provide a complete picture of business activities.
To get the most out of dimension tables, it’s essential to understand their place in the larger process of dimensional modeling, which structures data for easy navigation and retrieval across dimensions like time, product, or region.
For example, in a retail data warehouse, you might have:
- A Product dimension that stores product names, categories, and brands.
- A Customer dimension that includes customer names, demographics, and locations.
- A Date dimension that breaks down data by day, month, quarter, and year.
These dimensions allow users to understand trends, track performance across different categories, and make data-driven decisions based on detailed breakdowns of key metrics.

Why Dimension Tables Are Essential in Data Warehousing
Dimension tables add critical value to a data warehouse by enabling flexible, multi-dimensional analysis. Here’s why they’re so important:
-
Adding Context to Metrics: Without dimensions, fact tables can only offer raw numbers. Dimension tables give those numbers meaning, allowing users to analyze sales by region, product category, time period, and more.
-
Supporting Multi-Dimensional Analysis: Dimensions enable slicing and dicing data across various perspectives. For example, a sales manager can filter data to see sales for a specific product, region, or time period. This is essential in targeted analyses like those done in a data mart, where each business unit focuses on relevant dimensions.
-
Enhancing Query Performance: Dimension tables can make querying easier and faster, as they provide a structured way to filter and group data. By pre-organizing data into relevant categories, dimensions reduce the need for complex calculations in queries, similar to how materialized views optimize performance in SQL, as we explored in materialized views in e-commerce.
-
Improving Data Usability: By categorizing data into intuitive, easy-to-understand attributes, dimensions improve data accessibility for users at all levels, from data analysts to business executives.
Dimension tables help transform raw data into actionable insights, making them indispensable in a well-designed data warehouse.
Key Components of a Dimension Table
A well-structured dimension table typically includes the following components:
-
Primary Key: A unique identifier (often a surrogate key) for each record in the dimension table. This key is used to link the dimension table to fact tables in queries.
-
Descriptive Attributes: Fields that describe the dimension. For example, in a Customer dimension, you might include attributes like name, age, gender, and region.
-
Hierarchies: Many dimension tables include hierarchies to allow drill-down analysis. For instance, in a Date dimension, hierarchies could include levels like year > quarter > month > day, enabling users to view data at different levels of granularity.
-
Metadata: Some dimensions include metadata, such as flags or categories, that add additional context. For instance, a Product dimension might include a flag for “discontinued products” or a Customer dimension might include a “VIP customer” flag.
Each of these components enhances the utility of the dimension table, making it easier to analyze, interpret, and leverage data in decision-making.
Examples of Common Dimension Tables
Here are some common dimension tables found in data warehouses and the value they provide:
1. Date Dimension
- Purpose: The Date dimension allows time-based analysis, helping businesses track trends, seasonality, and year-over-year performance.
- Key Attributes: Date key, day, month, quarter, year, fiscal periods, holiday indicator.
- Example Use Case: Analyzing monthly sales trends, comparing performance across quarters, and tracking holiday-driven revenue.
2. Customer Dimension
- Purpose: Stores customer-specific data, enabling businesses to analyze customer demographics, preferences, and behavior.
- Key Attributes: Customer ID, name, age, gender, location, loyalty tier, and income level.
- Example Use Case: Segmenting customers based on behavior, like those who frequently purchase specific products, or analyzing patterns using insights from SQL query execution order to understand how best to extract insights.
3. Product Dimension
- Purpose: Provides details about products, helping businesses assess product performance and understand customer preferences.
- Key Attributes: Product ID, product name, category, brand, price, and SKU.
- Example Use Case: Analyzing product sales by category, tracking brand performance, and identifying top-selling items, which is crucial when choosing the right chart type for your data to visualize the results effectively.
Best Practices for Designing Dimension Tables
To get the most out of your dimension tables, follow these best practices:
-
Define a Unique Primary Key
- Use a unique, non-changing surrogate key as the primary key for each dimension. This key simplifies joins with fact tables and ensures data integrity.
-
Focus on Business-Relevant Attributes
- Only include attributes that are relevant for analysis. Overloading dimensions with unnecessary fields can slow down queries and make analysis more complex. Prioritize attributes that support key business questions.
-
Build and Document Hierarchies
- Create hierarchies within dimensions to enable drill-down and roll-up analysis. For example, the Location dimension can include continent > country > state > city. Document these hierarchies to ensure consistent usage by analysts.
-
Handle Slowly Changing Dimensions (SCDs) Properly
- Some attributes, like customer address or product price, may change over time. Use slowly changing dimension (SCD) techniques to track these changes without losing historical accuracy. Common types include Type 1 (overwrite), Type 2 (add new row for changes), and Type 3 (add a new column for previous value).
-
Maintain Consistent Naming Conventions
- Use clear and consistent naming conventions for columns and tables to improve usability. For example, using “Customer_Age” rather than “Cust_Age” makes it easier for end-users to understand the data.
These best practices will help you design dimension tables that are efficient, intuitive, and aligned with business needs.
Conclusion
Dimension tables are a fundamental part of any data warehouse, adding the context and structure needed to transform raw data into actionable insights. By providing descriptive attributes, hierarchies, and well-defined relationships to fact tables, dimensions enable users to filter, analyze, and interpret data from multiple perspectives.
With well-designed dimension tables, businesses can unlock the full potential of their data warehouse, supporting flexible analysis that leads to smarter, data-driven decisions. For more foundational concepts, check out our guide on getting started with data engineering, where key principles are covered for designing and managing data effectively.
Related Blogs
Discover more from Data Master
Subscribe to get the latest posts sent to your email.