
In data warehousing, the Date dimension is an essential element for analyzing trends, comparing performance over time, and enabling in-depth time-based analysis. A well-designed Date dimension table allows organizations to retrieve data efficiently, reduces query time, and ensures consistency across reports. In this guide, we’ll explore how to optimize data retrieval using Date dimension tables, focusing on best practices like indexing, partitioning, and time-based aggregations.
1. The Role of the Date Dimension in Data Retrieval
A Date dimension table organizes dates and related time attributes, providing a structured way to analyze data across various time frames. Since most business intelligence (BI) processes and reports rely heavily on time-based analysis, an optimized Date dimension streamlines query performance and enables more detailed insights. When properly designed, it acts as the foundation for comparing historical trends, analyzing seasonal patterns, and conducting year-over-year evaluations. For a closer look at the value of dimension tables, see our guide on dimension tables and their role in data warehousing.
2. Structuring a Date Dimension for Performance
The structure of the Date dimension is critical for efficient data retrieval. Here are a few ways to optimize its layout:
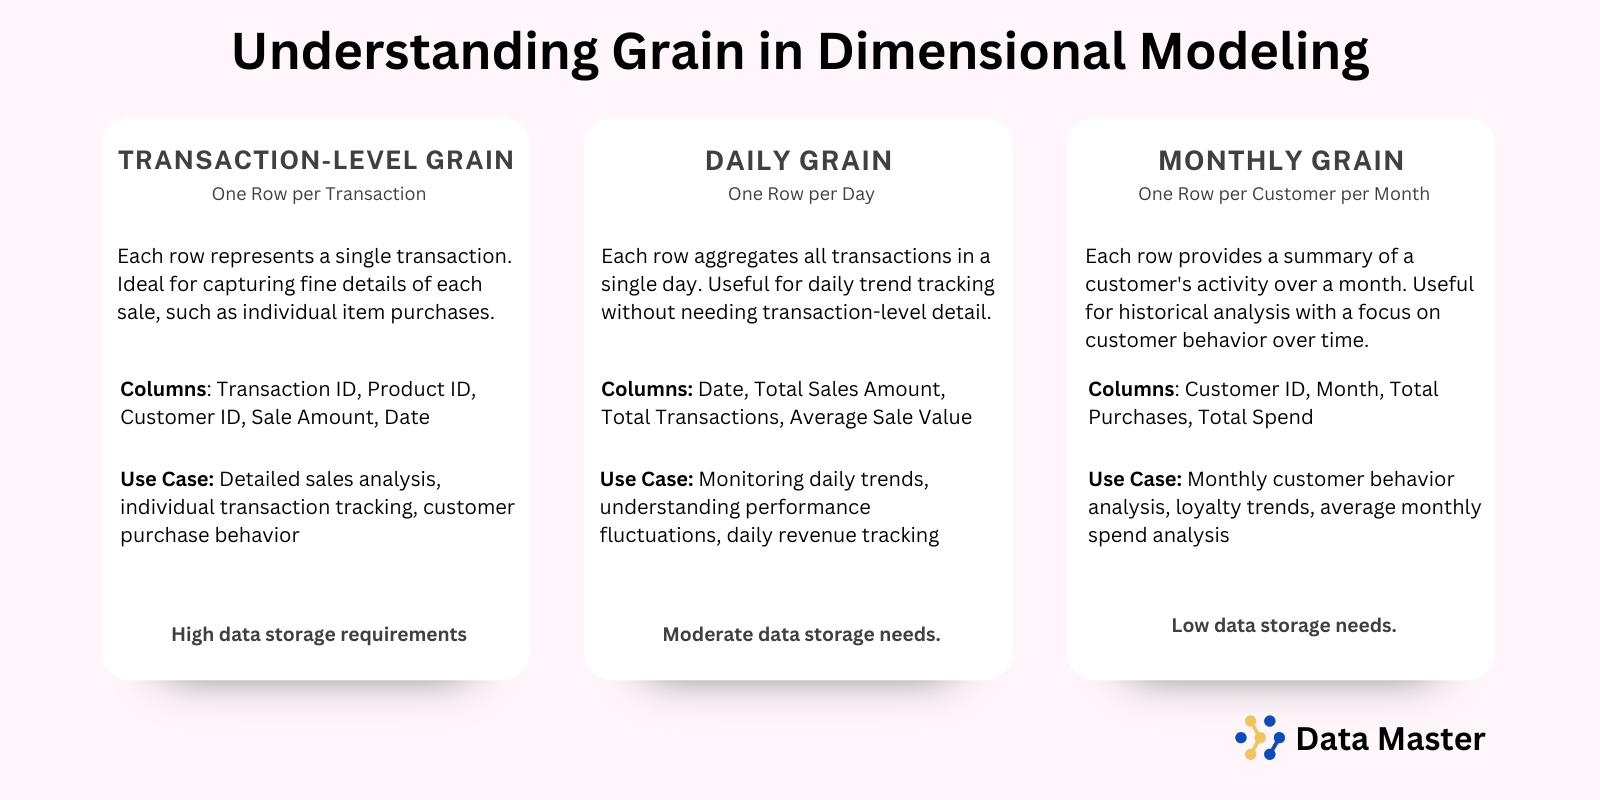
- Choosing the Right Grain: Decide on the level of detail needed, typically one row per day. This granularity supports daily analysis while simplifying aggregations by week, month, or quarter. Learn more about defining the grain in our article on the importance of declaring the grain in dimensional modeling.

- Essential Attributes: Standard attributes in a Date dimension include:
- Date Key: A unique identifier, usually in YYYYMMDD format.
- Day, Month, Quarter, Year: Core attributes that enable filtering and grouping at different time levels.
- Fiscal Year and Periods: Fiscal time attributes, such as Fiscal Year and Fiscal Quarter, are invaluable for accurate financial reporting.
- Holiday Flags: Adding a holiday indicator (e.g., a flag for national holidays) supports seasonal analysis and helps identify sales peaks or lows.
- Incorporating Time Hierarchies: Creating a hierarchy within the Date dimension (Year > Quarter > Month > Day) simplifies aggregations, allowing for smoother data roll-ups across different time frames. To explore the importance of hierarchies in dimensional modeling, visit our post on designing dimension tables in data warehousing.
3. Indexing and Partitioning for Faster Queries
Effective indexing and partitioning are two powerful techniques that enhance the performance of Date-based queries.
- Indexing on Date Key: Adding an index to frequently queried columns, like the Date Key, can significantly improve retrieval speed. When a Date dimension is joined with fact tables, indexing on Date Key enables faster filtering for date ranges. If you’re interested in optimizing fact tables, read our post on fact tables in data warehousing.
- Partitioning by Date: Partitioning fact tables by date, often by month or year, reduces the amount of data scanned during queries, speeding up performance. This is particularly beneficial for large datasets, where partitioning allows the database to only access relevant partitions.
- Materialized Views: Materialized views store pre-aggregated results and are useful for frequently used queries, especially those requiring complex joins or aggregations. Creating materialized views that summarize daily, monthly, or yearly data based on the Date dimension reduces the need for on-demand calculations. For more on this, see our guide to materialized views and optimization in data warehousing.
4. Leveraging Time-Based Aggregations
Time-based aggregations allow users to quickly retrieve commonly analyzed data, such as daily, weekly, or monthly totals. To enhance the efficiency of these aggregations, consider implementing the following:
- Summary Tables: Use summary tables to store pre-aggregated values for common time intervals, like daily sales, monthly revenue, or quarterly growth. These tables reduce the need to aggregate raw data each time a query is run.
- Caching Aggregates: Caching can store the results of frequently run aggregations, allowing for immediate retrieval without recalculating totals. This approach works well with the Date dimension, where daily or weekly summaries are commonly required.
- Slowly Changing Dimensions (SCDs): In cases where time attributes in the Date dimension might change, such as fiscal periods or holiday schedules, employing SCDs ensures historical accuracy. By using techniques like SCD Type 2 (creating a new row for each change), you can preserve changes over time without affecting existing reports.
5. Best Practices for Date Dimension Optimization
Optimizing a Date dimension goes beyond structuring the table; it includes consistent formatting, pre-calculations, and thorough documentation. Here are key practices to follow:
- Use Consistent Date Formats: Choose a standard Date Key format, like YYYYMMDD, and apply it consistently across the data warehouse. This prevents mismatches and simplifies joins with fact tables.
- Pre-calculate Date-Related Values: Populate the Date dimension table with common dates in advance, including holidays and fiscal periods, to eliminate on-the-fly calculations that could slow queries.
- Documentation and Maintenance: Document each attribute and regularly maintain the Date dimension, especially for fiscal year adjustments or holiday updates. Clear documentation supports usability and ensures that users understand each field’s purpose.
6. Use Cases: Examples of Optimized Date-Based Queries
An optimized Date dimension enhances a range of common analytical tasks. Here are a few examples:
- Trend Analysis: Queries that track trends, such as monthly revenue growth or seasonal shifts, are faster and easier to execute with a well-structured Date dimension. Aggregations at different time levels become more efficient, providing insights at the daily, monthly, or yearly level.
- Seasonal Analysis: Leveraging attributes like holiday flags or fiscal periods allows for quick seasonal performance analysis, which is particularly useful for industries affected by holiday shopping or seasonal demand cycles. Our POS dimensional model case study illustrates how seasonal analysis can be enhanced in a retail data warehouse.
- Year-over-Year Comparisons: Efficient year-over-year comparisons require a well-optimized Date dimension. Attributes such as Year and Fiscal Year allow for straightforward filtering, helping analysts assess performance changes over time.
Conclusion
A well-optimized Date dimension is central to effective data retrieval in data warehousing. By structuring the Date table with key attributes, incorporating indexing and partitioning, and leveraging time-based aggregations, organizations can ensure that data retrieval is fast, efficient, and reliable. Following these best practices allows for seamless time-based analysis, helping businesses unlock meaningful insights from their data.
For further exploration of dimension design and data warehousing, explore our articles on dimension tables and Star vs. Snowflake schema design, which can help you decide on the right schema structure for your data.
Discover more from Data Master
Subscribe to get the latest posts sent to your email.