
Data warehousing has revolutionized how organizations manage and analyze large datasets, enabling them to make data-driven decisions more effectively. At the core of a well-designed data warehouse is the fact table—the backbone of dimensional modeling. Fact tables capture key business metrics, providing measurable insights into various processes.
In this post, we’ll dive into what fact tables are, their components, types, and the best practices for designing them. By the end, you’ll understand how fact tables work and why they’re essential for data analysis.
What Is a Fact Table?
A fact table is the primary table in a dimensional model, capturing quantitative data or metrics from a business process. Each row in a fact table represents a single measurement, such as a transaction, sale, or order. These measurements are often numeric and additive, meaning they can be summed across dimensions like time or location.
For example, in a sales database, the fact table might store metrics like “sales amount,” “quantity sold,” or “discount applied.” Fact tables also contain foreign keys that link to related dimension tables, providing additional context to each metric.
Components of a Fact Table
A well-structured fact table includes two main components:
- Numeric Facts: These are the actual measurements or metrics that quantify a business process. Numeric facts are typically additive and include values like sales amount, revenue, or units sold.
- Foreign Keys: Foreign keys connect the fact table to dimension tables, linking each metric to details like product, customer, location, and time. These foreign keys are essential for building relationships across the data warehouse.
This simple structure allows for easy navigation, enabling users to access and analyze data based on various criteria.
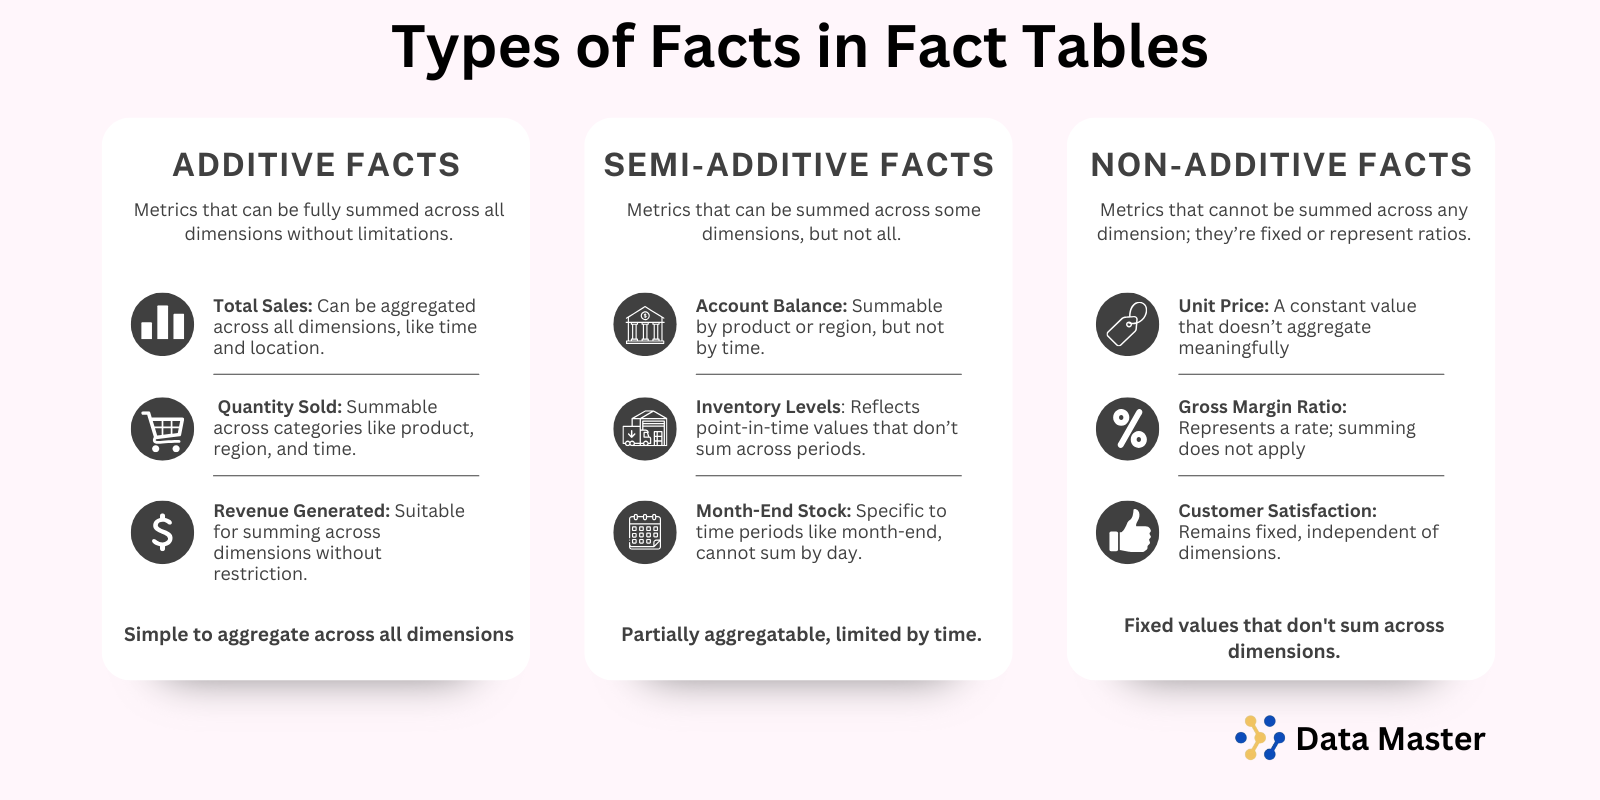
Types of Facts in Fact Tables
Fact tables can contain three types of facts, each serving different analytical purposes. Understanding these types helps ensure that fact tables meet the needs of the organization.

- Additive Facts
Additive facts can be summed up across any dimension in the data model. They are the most common type of fact in a fact table and allow for simple aggregation. Examples include:
Sales Amount: Total dollar amount of sales.
Quantity Sold: Total units sold.
Additive facts provide a straightforward way to analyze data across dimensions, such as total sales per month, per store, or per product category. - Semi-Additive Facts
Semi-additive facts can only be aggregated across some dimensions. For instance, inventory levels can be summed up across different products but not across time. Examples include:
Account Balance: Summable across accounts but not over time periods.
Inventory Levels: Can be summed up across products but not time.
Semi-additive facts are commonly used in fields like finance, where certain values make sense only within a specific context. - Non-Additive Facts
Non-additive facts cannot be summed across any dimension. Instead, they represent values like unit prices or ratios that should remain constant across all contexts. Examples include:
Unit Price: Price per unit that cannot be summed across multiple rows.
Gross Margin Ratio: Represents a percentage that can be averaged but not summed.
These facts are useful when dealing with data that describes properties of individual items or calculated values.
Grain of the Fact Table
The grain of a fact table defines the level of detail captured by each row. In other words, it describes the “resolution” of the data, determining what each row represents. Grain is one of the most critical decisions in fact table design, as it influences data accuracy and storage requirements.For a deeper understanding of how granularity impacts performance, you might find it helpful to explore materialized views, which are often used to optimize large data sets.
Examples of grain include:
- Retail Sales: Each row might represent a single item sold at a particular store on a specific date.
- Healthcare Claims: Each row might represent a single medical service provided to a patient.
- Financial Transactions: Each row could represent a single banking transaction on a specific account.
Defining the correct grain is essential because it affects how data can be analyzed. Choosing the wrong grain may limit the table’s utility and create challenges when users need more detailed or aggregated data.
Common Fact Table Examples
Let’s look at a few fact table examples in various industries to understand how they capture different business metrics:
- Sales Fact Table: Used in retail, this table might track each sale with metrics like sales amount, quantity sold, and discount. Dimension keys could link to tables for date, store, product, and customer.
- Inventory Fact Table: Common in manufacturing or warehousing, this table could capture inventory levels, reorder quantities, and storage costs. It often includes dimensions like product, location, and date.
- Transaction Fact Table: Found in finance, this table may record each transaction with metrics like transaction amount and balance. Dimensions could include date, account, and transaction type.
Each of these fact tables is designed to measure a specific business process and provide actionable insights through data analysis.
Best Practices for Designing Fact Tables
When designing fact tables, there are a few best practices that can help ensure they meet organizational needs:
- Choose Appropriate Facts: Select facts that align with the business questions the data warehouse should answer. Avoid including irrelevant metrics that may clutter the table.
- Ensure Consistency with the Grain: All facts in the table should match the declared grain. For instance, if the grain is “one row per transaction,” each row should capture metrics specific to that transaction only.
- Use Descriptive Column Names: Label each fact column clearly to reflect its purpose and context. Descriptive names make it easier for users to understand the data without consulting documentation.
- Optimize for Additivity: Use additive facts where possible, as they simplify aggregation and improve query performance.
- Avoid Calculated Ratios in Fact Tables: Ratios and percentages can often be calculated in the reporting layer. Storing raw values like total revenue and total cost allows for more flexibility.
By following these best practices in data warehouse design, data professionals can design fact tables that are easier to navigate, more efficient to query, and highly valuable for business analysis.
Conclusion
Fact tables are an essential element of dimensional modeling, capturing the metrics and measurements that organizations need to make informed decisions. With a clear understanding of fact types, grain, and best design practices, data professionals can create fact tables that drive effective reporting and insightful analytics.
Whether you’re working with sales data, finance, or operations data, understanding how to design fact tables is a fundamental skill that enhances your ability to support data-driven decision-making. With the right approach, your fact tables will serve as a reliable foundation for meaningful business insights.
Discover more from Data Master
Subscribe to get the latest posts sent to your email.